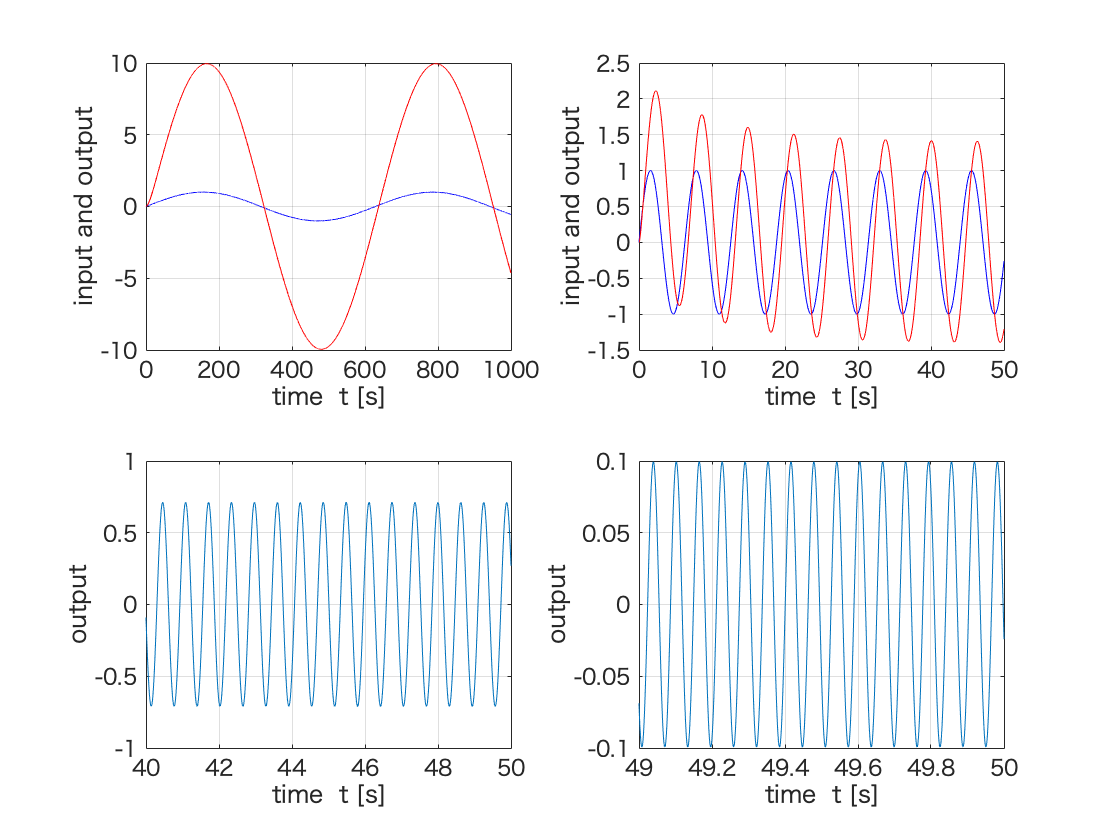
clear all; close all;
A = 1;
omega1 = 0.01;
omega2 = 1.0;
omega3 = 10;
omega4 = 100.0;
num = [ 0 10 10 ];
den = [ 1 10.1 1 ];
sys = tf( num, den );
t1 = 0:0.1:1000;
u1 = A*sin( omega1*t1 );
x0 = [ 0 ];
[ y1, t1, x1 ] = lsim( sys, u1, t1, x0 );
subplot(2,2,1)
plot(t1,u1,'-b',t1,y1,'-r');
xlim([0,1000])
ylim([-10 10])
xticks([0 200 400 600 800 1000])
yticks([-10 -5 0.0 5 10])
grid;
xlabel('time t [s]');
ylabel('input and output')
t2 = 0:0.001:50;
u2 = A*sin( omega2*t2 );
x0 = [ 0 ];
[ y2, t2, x1 ] = lsim( sys, u2, t2, x0 );
subplot(2,2,2)
plot(t2,u2,'-b',t2,y2,'-r');
xlim([0,50])
ylim([-1.5 2.5])
xticks([0 10 20 30 40 50])
yticks([-1.5 -1.0 -0.5 0.0 0.5 1.0 1.5 2.0 2.5])
grid;
xlabel('time t [s]');
ylabel('input and output')
u3 = A*sin( omega3*t2 );
x0 = [ 0 ];
[ y3, t3, x3 ] = lsim( sys, u3, t2, x0 );
subplot(2,2,3)
plot(t3,y3);
xlim([40,50])
ylim([-1.0 1.0])
xticks([40 42 44 46 48 50])
yticks([-1.0 -0.5 0.0 0.5 1.0])
grid;
xlabel('time t [s]');
ylabel('output')
u4 = A*sin( omega4*t2 );
x0 = [ 0 ];
[ y4, t4, x4 ] = lsim( sys, u4, t2, x0 );
subplot(2,2,4)
plot(t4,y4);
xlim([49,50])
ylim([-0.10 0.10])
xticks([49.0 49.2 49.4 49.6 49.8 50])
yticks([-0.10 -0.05 0 0.05 0.10])
grid;
xlabel('time t [s]');
ylabel('output')

