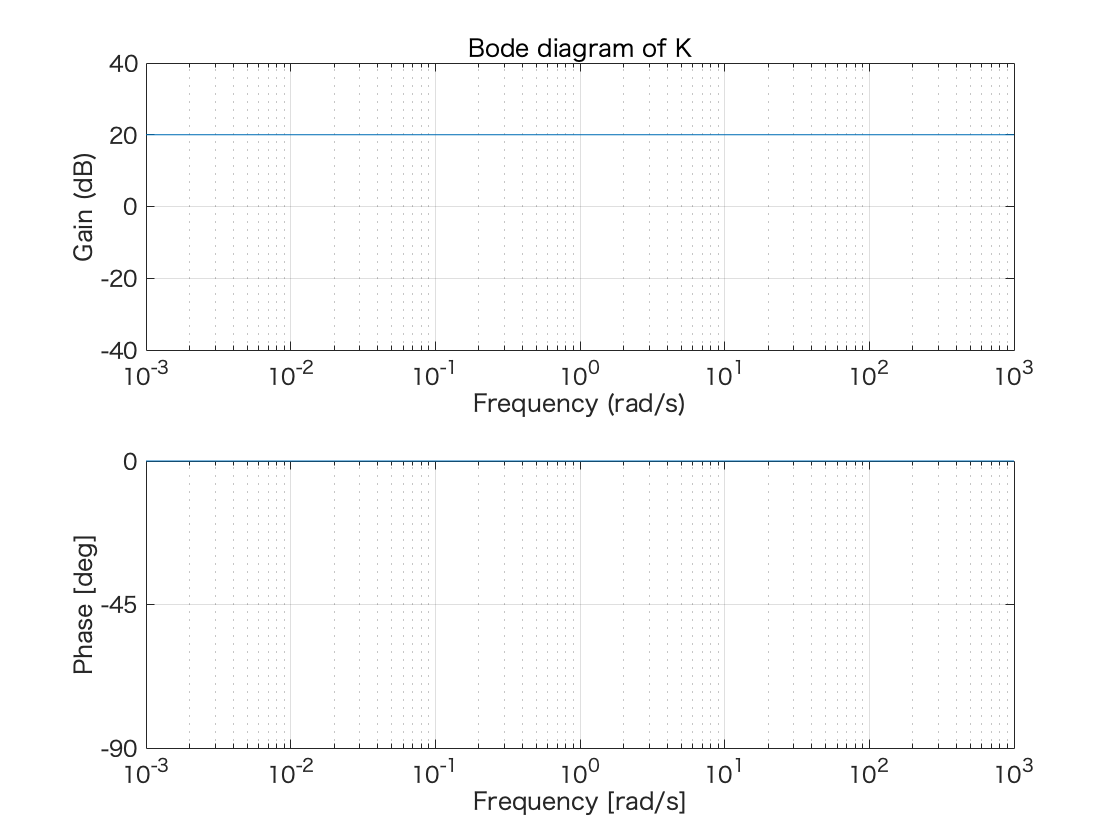
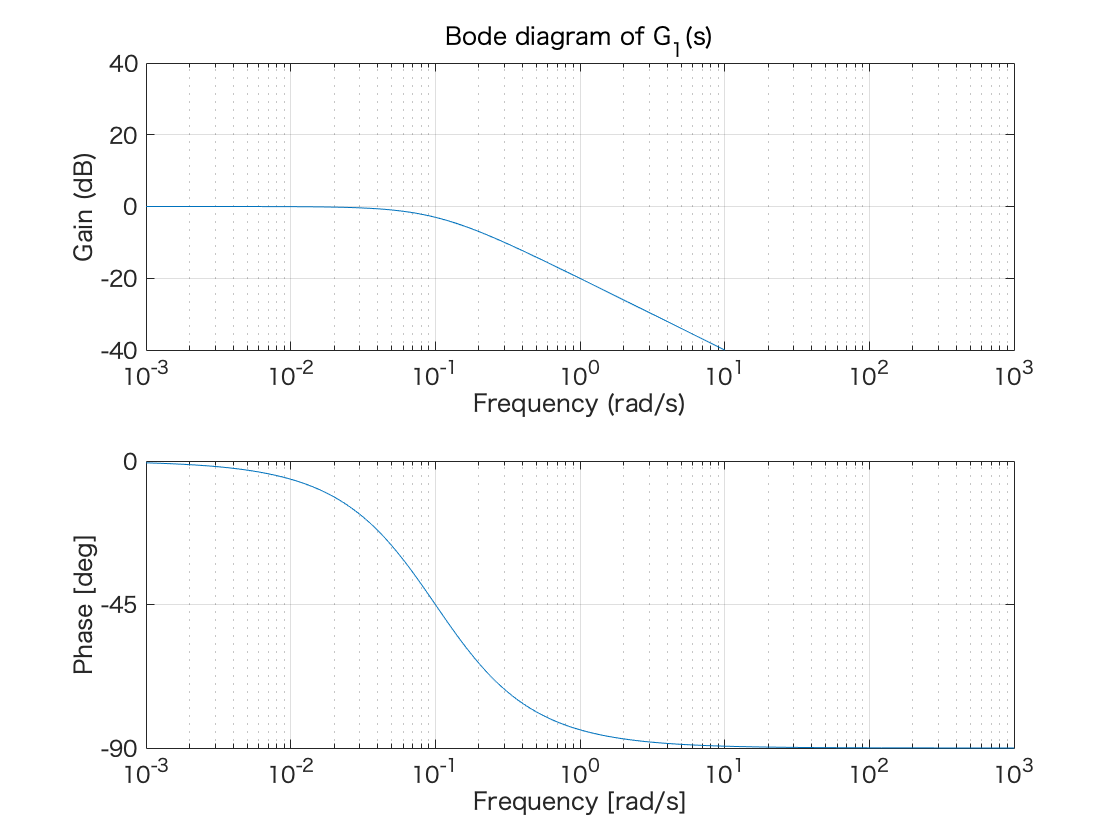
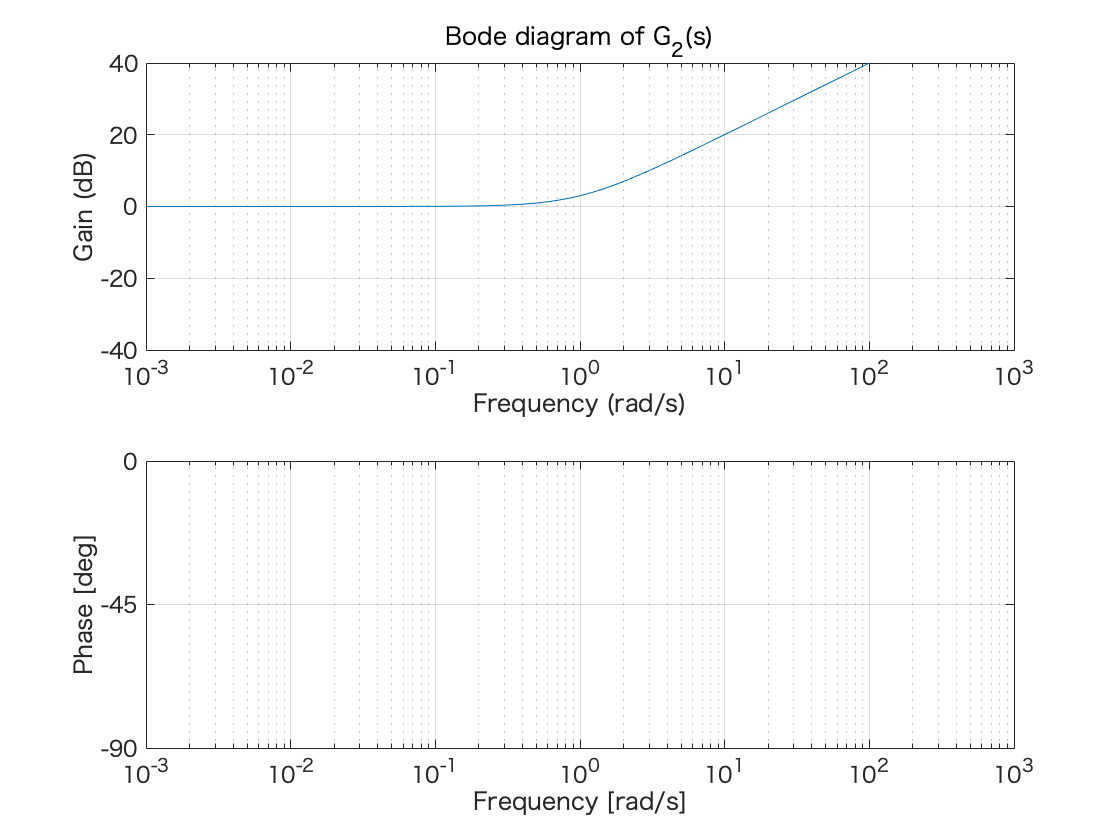
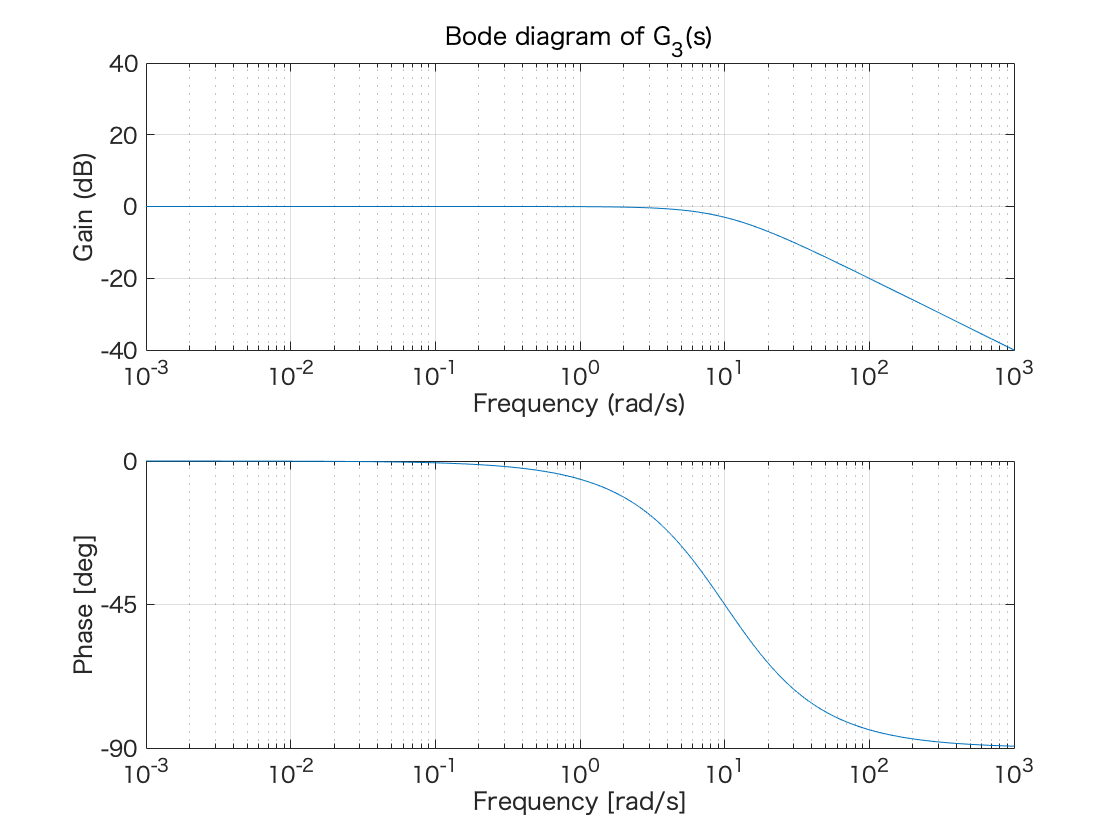
clear all; close all;
numK = [ 10 ];
denK = [ 1 ];
num1 = [ 0 1 ];
den1 = [ 10 1 ];
num2 = [ 1 1 ];
den2 = [ 0 1 ];
num3 = [ 0 1 ];
den3 = [ 0.1 1 ];
sysK = tf( numK, denK );
sys1 = tf( num1, den1 );
sys2 = tf( num2, den2 );
sys3 = tf( num3, den3 );
w = logspace(-3, 3, 1000);
[ gainK phaseK wK ] = bode( sysK, w );
gainK = gainK(:);
gainKdB = 20*log10(gainK);
phaseK = phaseK(:);
[ gain1 phase1 w1 ] = bode( sys1, w );
gain1 = gain1(:);
gain1dB = 20*log10(gain1);
phase1 = phase1(:);
[ gain2 phase2 w2 ] = bode( sys2, w );
gain2 = gain2(:);
gain2dB = 20*log10(gain2);
phase2 = phase2(:);
[ gain3 phase3 w3 ] = bode( sys3, w );
gain3 = gain3(:);
gain3dB = 20*log10(gain3);
phase3 = phase3(:);
figure(1)
subplot(2,1,1)
semilogx(wK, gainKdB);
xlim([10^(-3),10^3])
ylim([-40 40])
grid;
xlabel('Frequency (rad/s)');
ylabel('Gain (dB)');
title('Bode diagram of K')
subplot(2,1,2)
semilogx(wK, phaseK);
xlim([10^(-3),10^3])
ylim([-90 0])
yticks([-90 -45 0])
grid;
xlabel('Frequency [rad/s]');
ylabel('Phase [deg]');
figure(2)
subplot(2,1,1)
semilogx(w1, gain1dB);
xlim([10^(-3),10^3])
ylim([-40 40])
grid;
xlabel('Frequency (rad/s)');
ylabel('Gain (dB)');
title('Bode diagram of G_1(s)')
subplot(2,1,2)
semilogx(w1, phase1);
xlim([10^(-3),10^3])
ylim([-90 0])
yticks([-90 -45 0])
grid;
xlabel('Frequency [rad/s]');
ylabel('Phase [deg]');
figure(3)
subplot(2,1,1)
semilogx(w2, gain2dB);
xlim([10^(-3),10^3])
ylim([-40 40])
grid;
xlabel('Frequency (rad/s)');
ylabel('Gain (dB)');
title('Bode diagram of G_2(s)')
subplot(2,1,2)
semilogx(w2, phase2);
xlim([10^(-3),10^3])
ylim([-90 0])
yticks([-90 -45 0])
grid;
xlabel('Frequency [rad/s]');
ylabel('Phase [deg]');
figure(4)
subplot(2,1,1)
semilogx(w3, gain3dB);
xlim([10^(-3),10^3])
ylim([-40 40])
grid;
xlabel('Frequency (rad/s)');
ylabel('Gain (dB)');
title('Bode diagram of G_3(s)')
subplot(2,1,2)
semilogx(w3, phase3);
xlim([10^(-3),10^3])
ylim([-90 0])
yticks([-90 -45 0])
grid;
xlabel('Frequency [rad/s]');
ylabel('Phase [deg]');
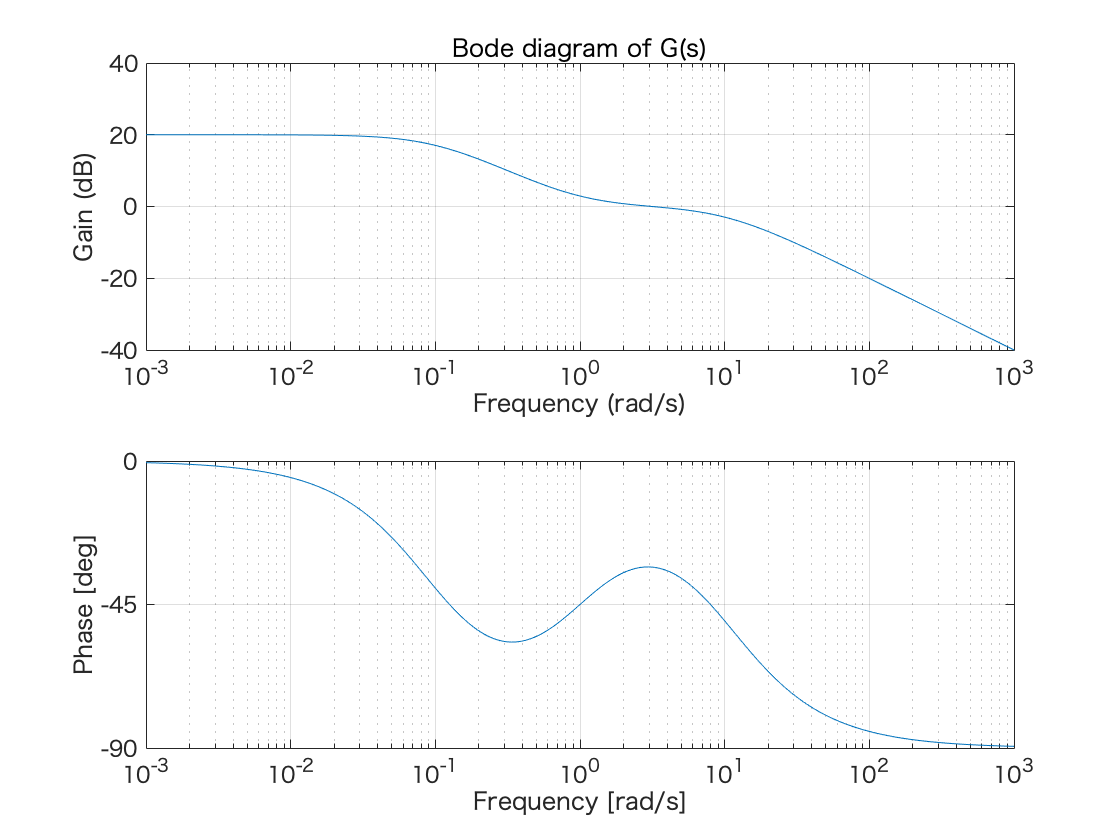
figure(5)
subplot(2,1,1)
semilogx(w3, gainKdB + gain1dB + gain2dB + gain3dB);
xlim([10^(-3),10^3])
ylim([-40 40])
grid;
xlabel('Frequency (rad/s)');
ylabel('Gain (dB)');
title('Bode diagram of G(s)')
subplot(2,1,2)
semilogx(w3, phaseK + phase1 + phase2 + phase3);
xlim([10^(-3),10^3])
ylim([-90 0])
yticks([-90 -45 0])
grid;
xlabel('Frequency [rad/s]');
ylabel('Phase [deg]');
