clear all; close all;
K = 1;
omegan = 0.1;
zeta = 0.2;
num = [ K * omegan^2 ];
den = [ 1 2*zeta*omegan omegan^2 ];
numc0 = [ 1 ];
denc0 = [ 1 ];
numc1 = [ 100 ];
denc1 = [ 1 ];
omega1 = 0.1;
numPLG = [ 1 omega1 ];
denPLG = [ 1 0 ];
omega3 = 8;
omega4 = 0.5;
numPLE = [ omega3 omega3 * omega4 ];
denPLE = [ omega4 omega4 * omega3 ];
sys = tf( num, den );
c0 = tf( numc0, denc0 );
c1 = tf( numc1, denc1 );
cPLG = tf( numPLG, denPLG );
cPLE = tf( numPLE, denPLE );
sysL0 = c0*sys;
sysL1 = c1*sys;
sysL2 = c1*cPLG*sys;
sysL3 = c1*cPLG*cPLE*sys;
w = logspace(-2, 2, 1000);
figure(1)
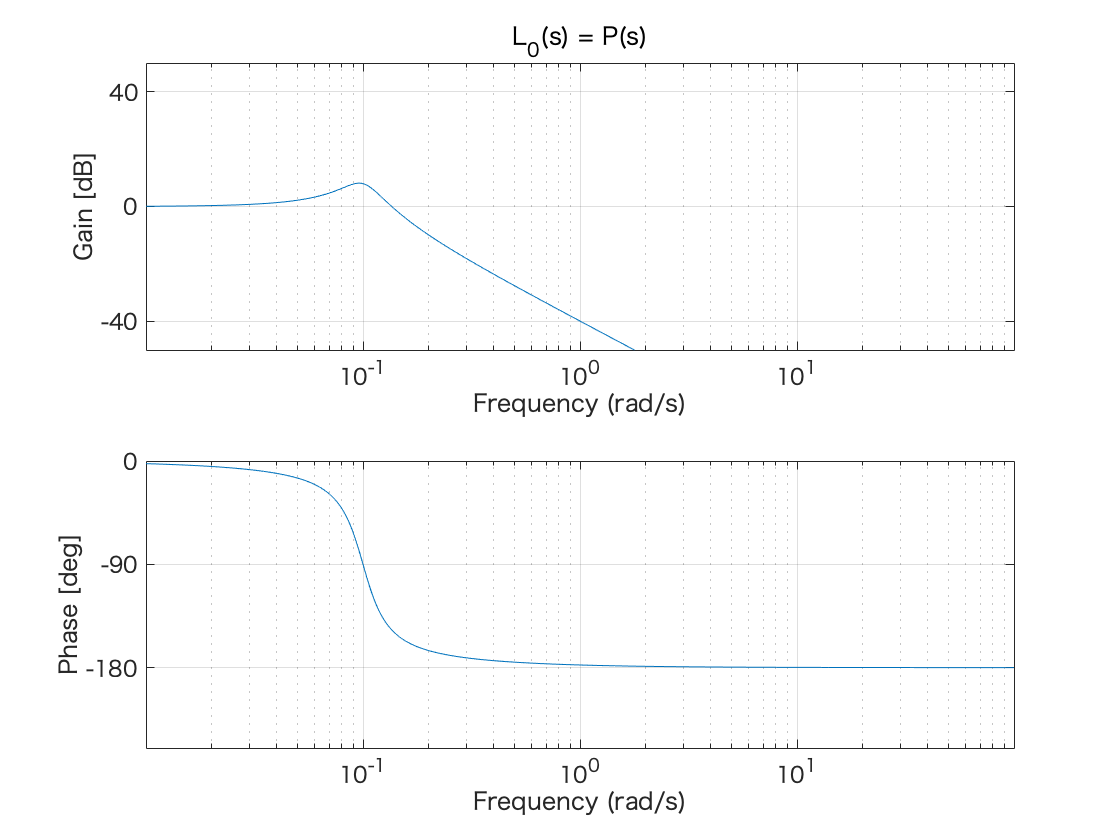
[ gainL0 phaseL0 wL0 ] = bode( sysL0, w );
gainL0 = gainL0(:);
gainL0dB = 20*log10(gainL0);
phaseL0 = phaseL0(:);
subplot(2,1,1)
semilogx(wL0, gainL0dB);
xlim([10^(-2),10^(2)])
ylim([-50 50])
xticks([10^(-1) 10^(0) 10^(1)])
yticks([-40 0 40])
grid;
xlabel('Frequency (rad/s)');
ylabel('Gain [dB]');
title('L_0(s) = P(s)')
subplot(2,1,2)
semilogx(wL0, phaseL0);
xlim([10^(-2),10^(2)])
ylim([-250 0])
xticks([10^(-1) 10^(0) 10^(1)])
yticks([-180 -90 0])
grid;
xlabel('Frequency (rad/s)');
ylabel('Phase [deg]');
figure(2)
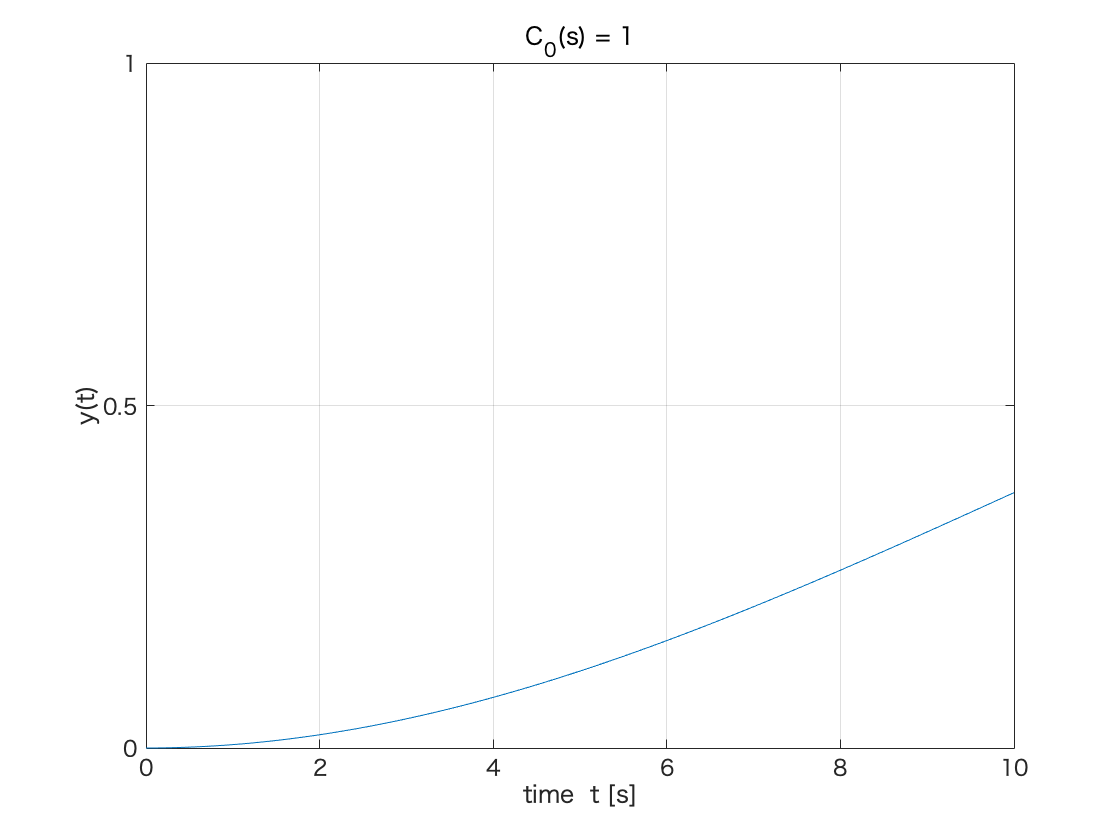
sysc0 = feedback( sysL0, 1 );
t = 0:0.01:10;
[ y0, t0 ] = step( sysc0, t );
plot(t0,y0);
xlim([0,10])
ylim([0.0 1.0])
xticks([0 2 4 6 8 10])
yticks([0.0 0.5 1.0])
grid;
xlabel('time t [s]');
ylabel('y(t)')
title('C_0(s) = 1')
figure(3)
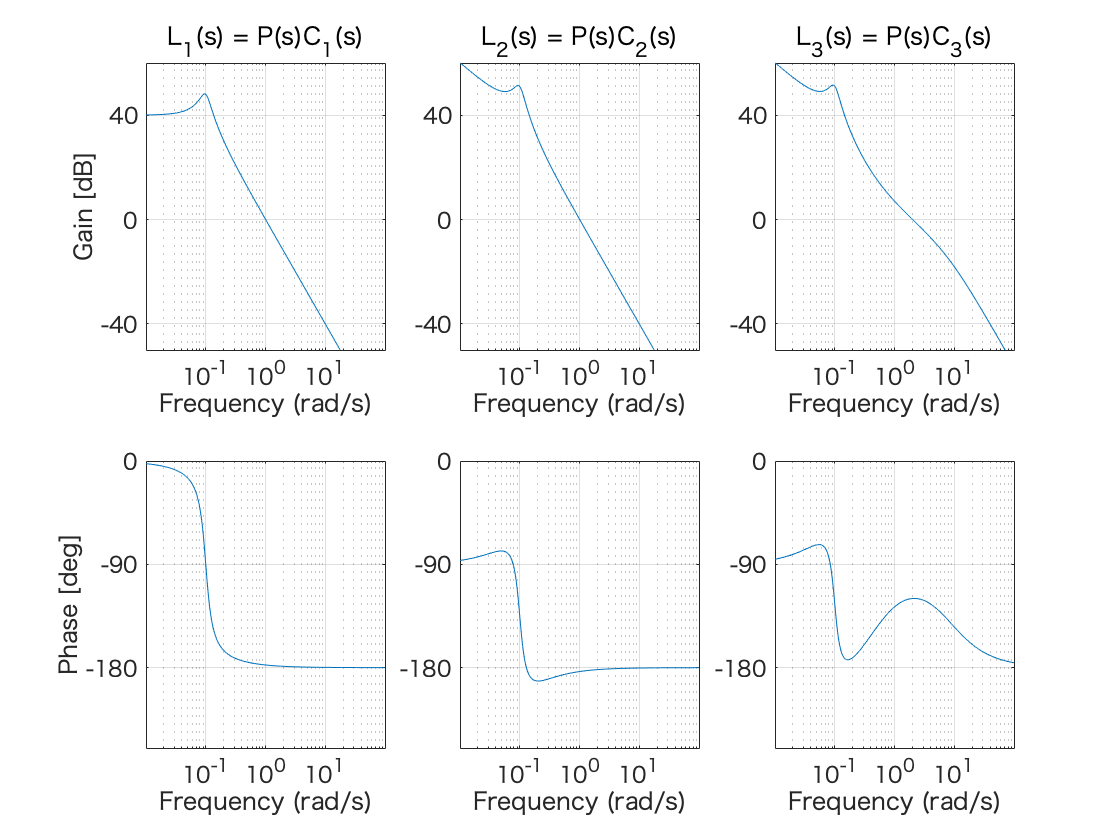
[ gainL1 phaseL1 wL1 ] = bode( sysL1, w );
gainL1 = gainL1(:);
gainL1dB = 20*log10(gainL1);
phaseL1 = phaseL1(:);
subplot(2,3,1)
semilogx(wL1, gainL1dB);
xlim([10^(-2),10^(2)])
ylim([-50 60])
xticks([10^(-1) 10^(0) 10^(1)])
yticks([-40 0 40])
grid;
xlabel('Frequency (rad/s)');
ylabel('Gain [dB]');
title('L_1(s) = P(s)C_1(s)')
subplot(2,3,4)
semilogx(wL1, phaseL1);
xlim([10^(-2),10^(2)])
ylim([-250 0])
xticks([10^(-1) 10^(0) 10^(1)])
yticks([-180 -90 0])
grid;
xlabel('Frequency (rad/s)');
ylabel('Phase [deg]');
[ gainL2 phaseL2 wL2 ] = bode( sysL2, w );
gainL2 = gainL2(:);
gainL2dB = 20*log10(gainL2);
phaseL2 = phaseL2(:);
subplot(2,3,2)
semilogx(wL2, gainL2dB);
xlim([10^(-2),10^(2)])
ylim([-50 60])
xticks([10^(-1) 10^(0) 10^(1)])
yticks([-40 0 40])
grid;
xlabel('Frequency (rad/s)');
title('L_2(s) = P(s)C_2(s)')
subplot(2,3,5)
semilogx(wL2, phaseL2);
xlim([10^(-2),10^(2)])
ylim([-250 0])
xticks([10^(-1) 10^(0) 10^(1)])
yticks([-180 -90 0])
grid;
xlabel('Frequency (rad/s)');
[ gainL3 phaseL3 wL3 ] = bode( sysL3, w );
gainL3 = gainL3(:);
gainL3dB = 20*log10(gainL3);
phaseL3 = phaseL3(:);
subplot(2,3,3)
semilogx(wL3, gainL3dB);
xlim([10^(-2),10^(2)])
ylim([-50 60])
xticks([10^(-1) 10^(0) 10^(1)])
yticks([-40 0 40])
grid;
xlabel('Frequency (rad/s)');
title('L_3(s) = P(s)C_3(s)')
subplot(2,3,6)
semilogx(wL3, phaseL3);
xlim([10^(-2),10^(2)])
ylim([-250 0])
xticks([10^(-1) 10^(0) 10^(1)])
yticks([-180 -90 0])
grid;
xlabel('Frequency (rad/s)');
figure(4)
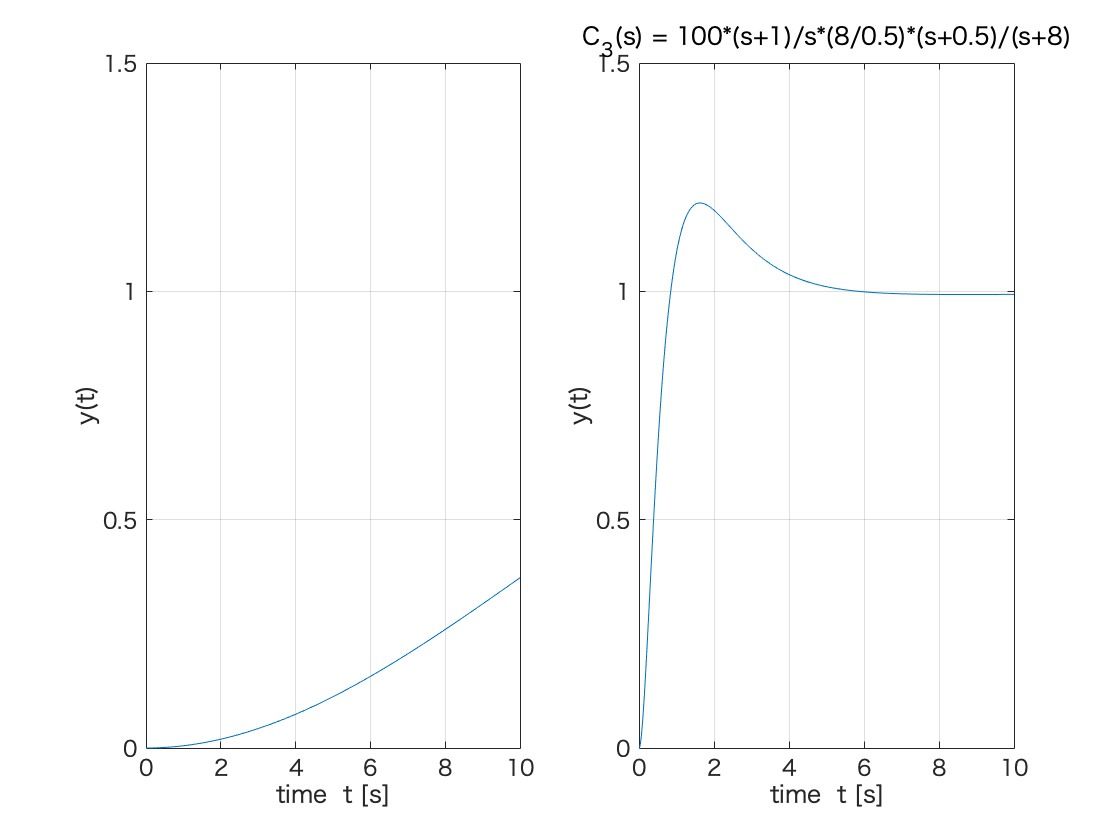
sysc3 = feedback( sysL3, 1 );
t = 0:0.01:10;
[ y3, t3 ] = step( sysc3, t );
subplot(1,2,1);
plot(t0,y0);
xlim([0,10])
ylim([0.0 1.5])
xticks([0 2 4 6 8 10])
yticks([0.0 0.5 1.0 1.5])
grid;
xlabel('time t [s]');
ylabel('y(t)')
subplot(1,2,2);
plot(t3,y3);
xlim([0,10])
ylim([0.0 1.5])
xticks([0 2 4 6 8 10])
yticks([0.0 0.5 1.0 1.5])
grid;
xlabel('time t [s]');
ylabel('y(t)')
title('C_3(s) = 100*(s+1)/s*(8/0.5)*(s+0.5)/(s+8)')


