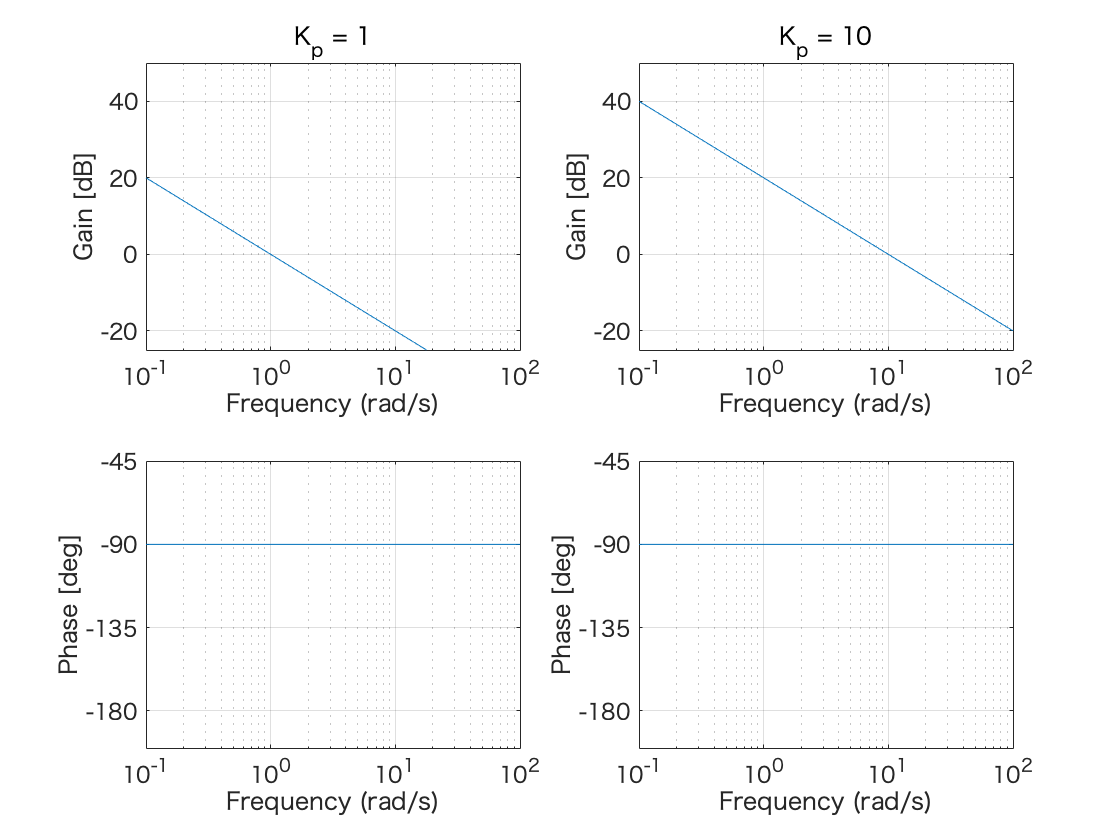
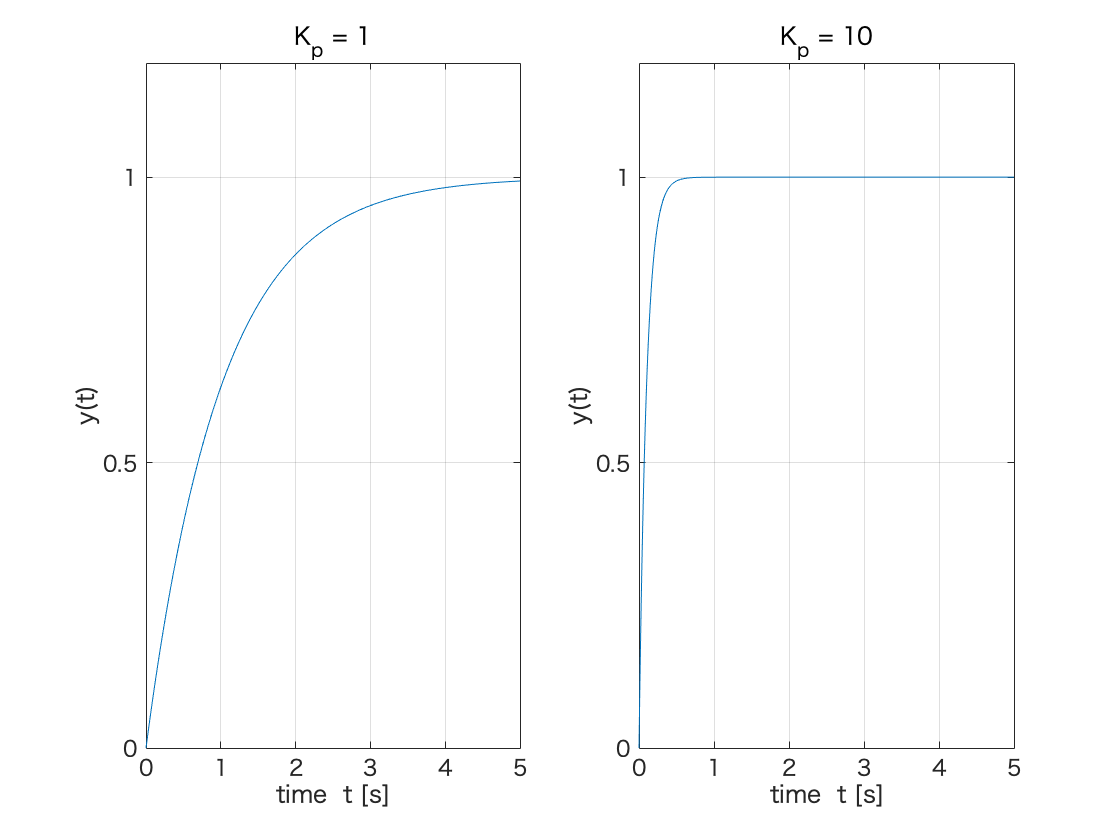
clear all; close all;
num = [ 1 ];
den = [ 1 0 ];
numc1 = [ 1 ];
numc2 = [ 10 ];
denc = [ 1 ];
sys = tf( num, den );
c1 = tf( numc1, denc );
c2 = tf( numc2, denc );
sysL1 = c1*sys;
sysL2 = c2*sys;
sysC1 = feedback( sysL1, 1 );
sysC2 = feedback( sysL2, 1 );
w = logspace(-1, 2, 1000);
figure(1)
[gainL1 phaseL1 wL1] = bode(sysL1, w);
gainL1 = gainL1(:);
gainL1dB = 20*log10(gainL1);
phaseL1 = phaseL1(:);
subplot(2,2,1)
semilogx(wL1, gainL1dB);
xlim([10^(-1),10^2])
ylim([-25 50])
xticks([10^(-1) 10^(0) 10^(1) 10^(2)])
yticks([-20 0 20 40])
grid;
xlabel('Frequency (rad/s)');
ylabel('Gain [dB]');
title('K_{p} = 1')
subplot(2,2,3)
semilogx(wL1, phaseL1);
xlim([10^(-1),10^2])
ylim([-200 -45])
xticks([10^(-1) 10^(0) 10^(1) 10^(2)])
yticks([-180 -135 -90 -45])
grid;
xlabel('Frequency (rad/s)');
ylabel('Phase [deg]');
[gainL2 phaseL2 wL2] = bode(sysL2, w);
gainL2 = gainL2(:);
gainL2dB = 20*log10(gainL2);
phaseL2 = phaseL2(:);
subplot(2,2,2)
semilogx(wL2, gainL2dB);
xlim([10^(-1),10^2])
ylim([-25 50])
xticks([10^(-1) 10^(0) 10^(1) 10^(2)])
yticks([-20 0 20 40])
grid;
xlabel('Frequency (rad/s)');
ylabel('Gain [dB]');
title('K_{p} = 10')
subplot(2,2,4)
semilogx(wL2, phaseL2);
xlim([10^(-1),10^2])
ylim([-200 -45])
xticks([10^(-1) 10^(0) 10^(1) 10^(2)])
yticks([-180 -135 -90 -45])
grid;
xlabel('Frequency (rad/s)');
ylabel('Phase [deg]');
figure(2)
t = 0:0.01:5;
[ y1, t1 ] = step( sysC1, t );
[ y2, t2 ] = step( sysC2, t );
subplot(1,2,1)
plot(t1,y1);
xlim([0 5])
ylim([0.0 1.2])
xticks([0 1 2 3 4 5])
yticks([0.0 0.5 1.0])
grid;
xlabel('time t [s]');
ylabel('y(t)')
title('K_{p} = 1')
subplot(1,2,2)
plot(t2,y2);
xlim([0 5])
ylim([0.0 1.2])
xticks([0 1 2 3 4 5])
yticks([0.0 0.5 1.0])
grid;
xlabel('time t [s]');
ylabel('y(t)')
title('K_{p} = 10')


