clear all; close all;
A = [0 1;-6 -5];
b = [0;1];
c = [1 0];
d = 0;
fbp1 = [-3; -3];
disp('求めるフィードバックゲイン');
f1 = acker(A,b,fbp1)
Af1 = A - b * f1
disp('閉ループ極')
eig(A - b * f1)
cp = eye(2);
dp = [0;0];
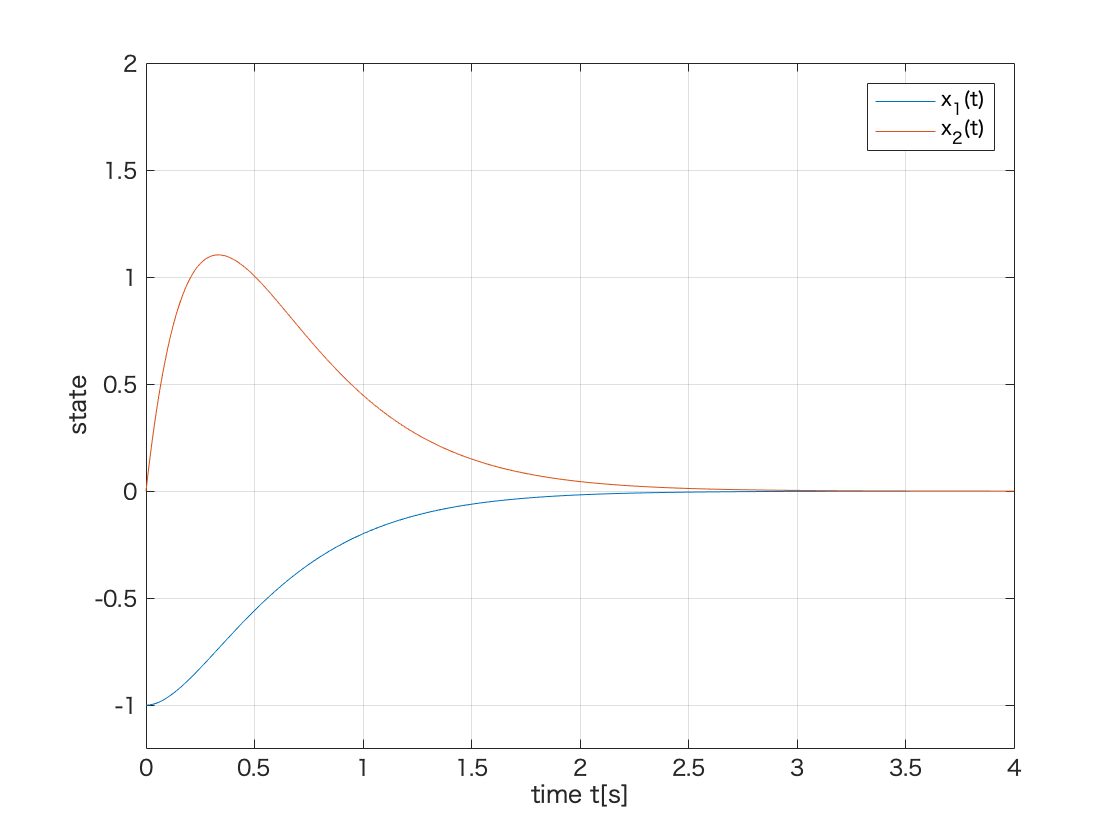
sys_s_fbk1 = ss(Af1, b, cp, dp);
t = 0:0.01:5;
x0 = [-1;0];
y1 = initial(sys_s_fbk1,x0,t);
figure(1)
plot(t,y1(:,1),t,y1(:,2));
xlim([0 4]);
ylim([-1.2 2]);
grid;
xlabel('time t[s]');
ylabel('state');
legend('x_1(t)','x_2(t)');
fbp2 = [-5; -5];
disp('求めるフィードバックゲイン');
f2 = acker(A,b,fbp2)
Af2 = A - b * f2
disp('閉ループ極')
eig(A - b * f2)
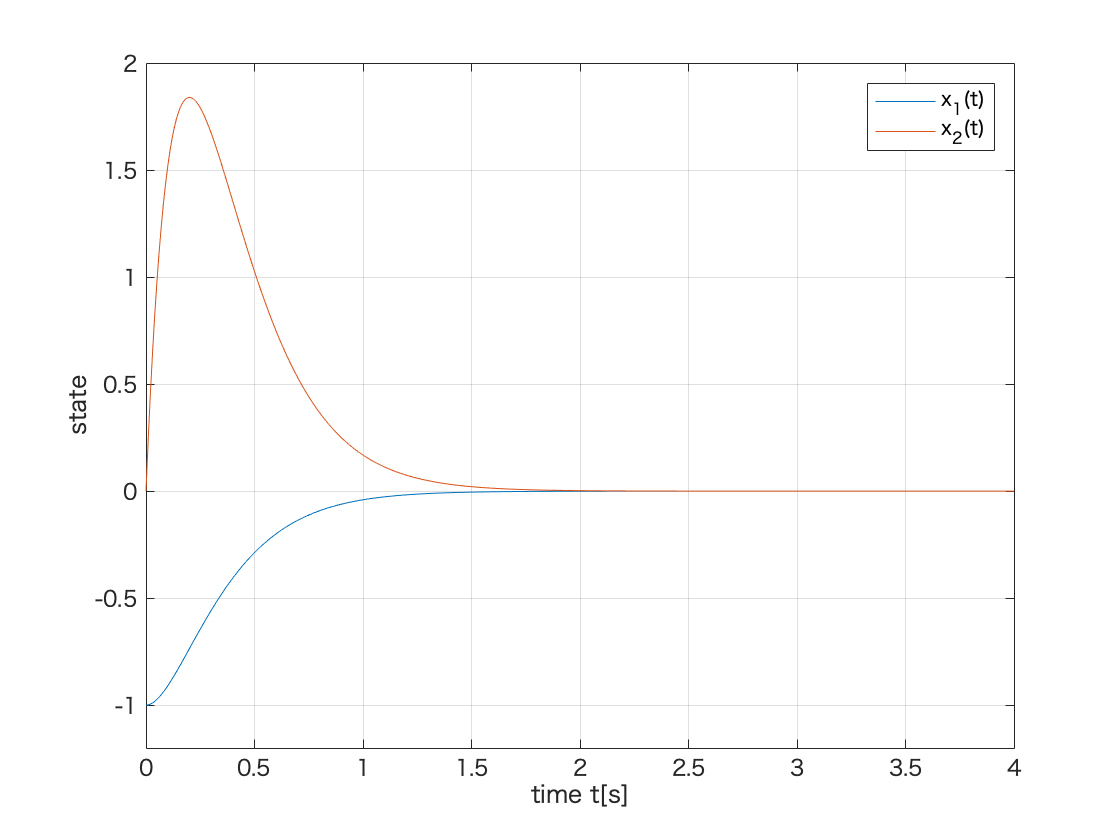
sys_s_fbk2 = ss(Af2, b, cp, dp);
y2 = initial(sys_s_fbk2,x0,t);
figure(2)
plot(t,y2(:,1),t,y2(:,2));
xlim([0 4]);
ylim([-1.2 2]);
grid;
xlabel('time t[s]');
ylabel('state');
legend('x_1(t)','x_2(t)');
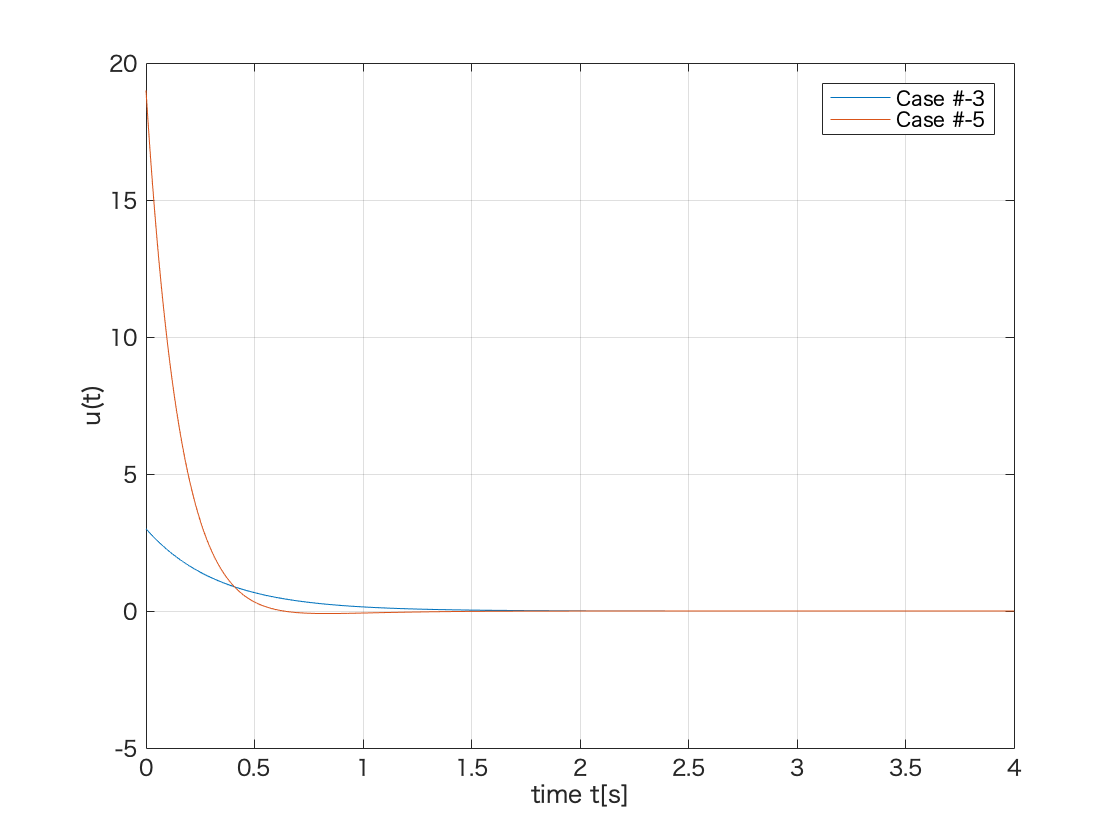
u1 = - f1(1) * y1(:,1) - f1(2) * y1(:,2);
u2 = - f2(1) * y2(:,1) - f2(2) * y2(:,2);
figure(3)
plot(t,u1,t,u2);
xlim([0 4]);
ylim([-5 20]);
grid;
xlabel('time t[s]');
ylabel('u(t)');
legend('Case #-3', 'Case #-5');
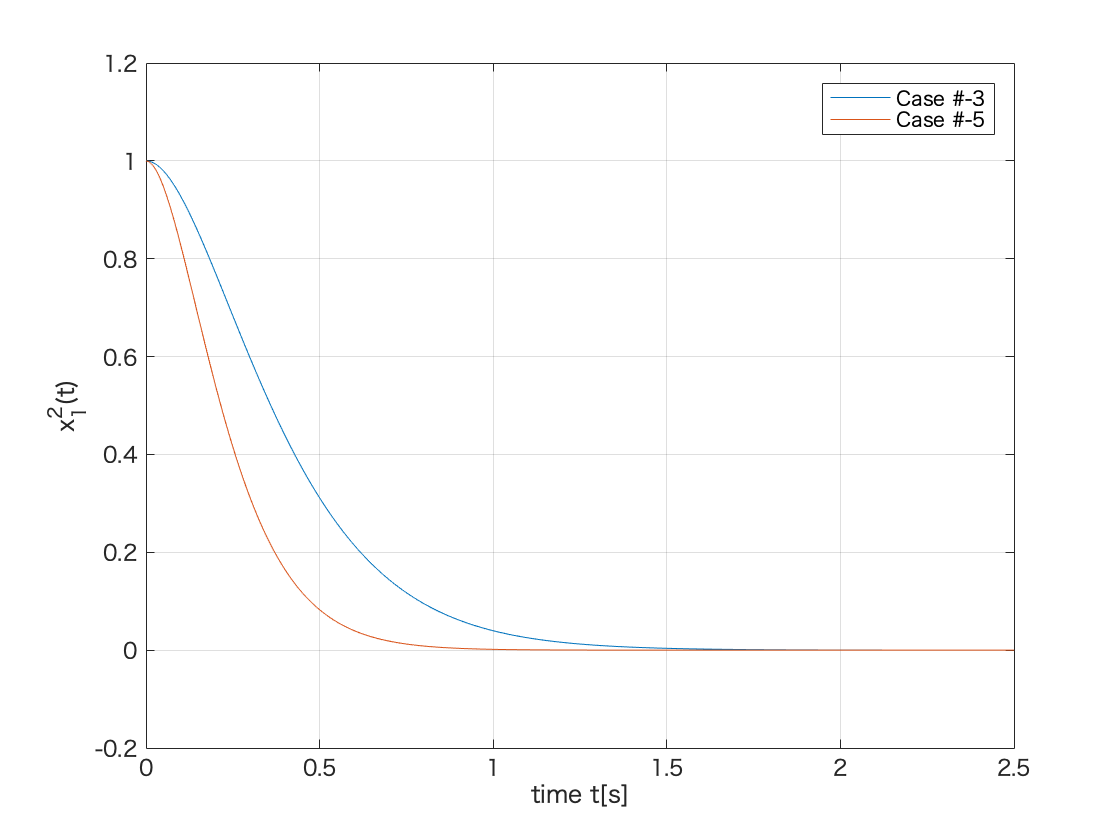
y112 = power(y1(:,1),2);
y122 = power(y1(:,2),2);
y212 = power(y2(:,1),2);
y222 = power(y2(:,2),2);
u12 = power(u1,2);
u22 = power(u2,2);
figure(4)
plot(t,y112,t,y212);
xlim([0 2.5]);
ylim([-0.2 1.2]);
grid;
xlabel('time t[s]');
ylabel('x_1^2(t)');
legend('Case #-3', 'Case #-5');
figure(5)
plot(t,y122,t,y222);
xlim([0 2.5]);
ylim([0 4]);
grid;
xlabel('time t[s]');
ylabel('x_2^2(t)');
legend('Case #-3', 'Case #-5');
figure(5)
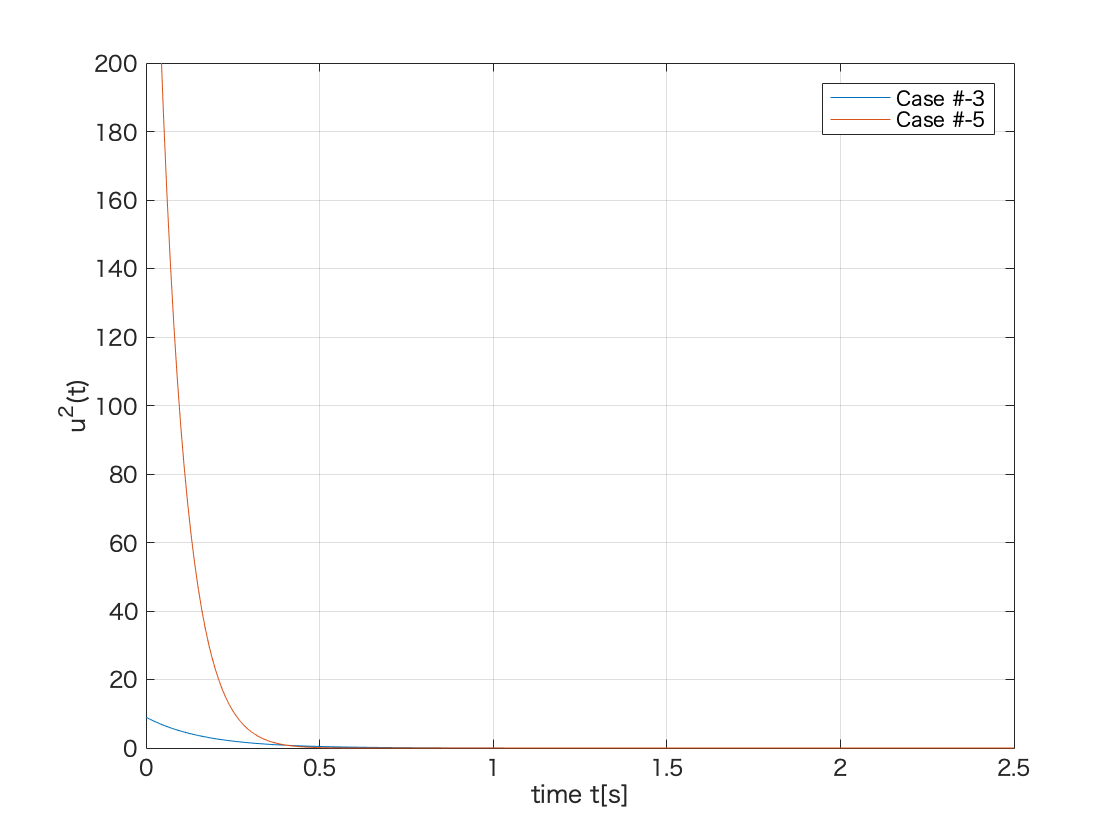
plot(t,u12,t,u22);
xlim([0 2.5]);
ylim([0 200]);
grid;
xlabel('time t[s]');
ylabel('u^2(t)');
legend('Case #-3', 'Case #-5');
求めるフィードバックゲイン

f1 =

     3     1


Af1 =

     0     1
    -9    -6

閉ループ極

ans =

  -3.0000 + 0.0000i
  -3.0000 - 0.0000i

求めるフィードバックゲイン

f2 =

    19     5


Af2 =

     0     1
   -25   -10

閉ループ極

ans =

    -5
    -5
